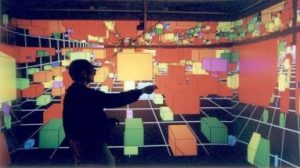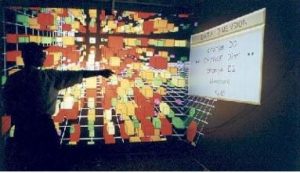


DIVE-ON is a visual data mining tool using a CAVE to render 3D scatterplot of sphere. The dataset is saved in a data warehouse and sphere position, color and size are used to encode attributes. In the example provided a sales dataset is used with spatial coordinate used for product, supplier, and location information while color represents profit margin and size gross revenue.
Cubic and spherical shape have been explored. Spherical shape was superior to limit occlusion and better depth understanding, especially through shadowing effect. However, those benefits come at the cost of computer processing.
