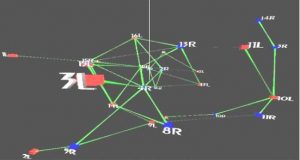
Genome3DExplorer is an immersive analytics system to explore the Yeast gene block duplications dataset through a 3D node/link visualization. Each node represents a chromosome, where its size is displayed through the node size and its side, right or left, through the node color, blue and red respectively. Nodes are positioned using a force-directed placement algorithm.
The user has access to a dataglove to move node as he would like, performing a pinch gesture to grab a node and then open his hand for release. Moreover, high level filter to show/hide visual elements, i.e. nodes, edges, and labels, can be triggered via voice commands, such as “show labels” or “hide edges”.