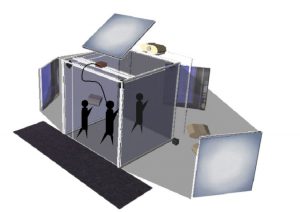
Water chemistry measurements made of wadeable streams in the mid-Atlantic states of USA were used for this immersive visualization. A 3D elevation map was modelized and measurement were located based on their GIS coordinate. This give the user a strong contextualization of the data with an easy link to the map topography. The size of the map was reduced to provide the user the sensation of stomping over a mini-map, such as a “Gulliver effect”.
Moreover simple brushing techniques was implemented by selecting a virtual tool from a 3D menu and then brushing over the relevant point with the wand.