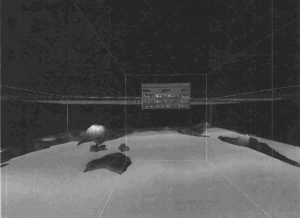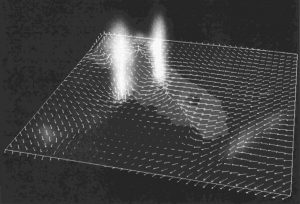


Vis5D is an immersive analytics system for studying climate variability on century time scale inside a CAVE. Data analysed is composed of atmospheric data, such as temperature, pressure, wind velocity, and water concentration in the atmosphere, and oceans data, such as temperature, current velocity, and salt concentration. Temperatures are represented trough colored isosurface, and velocity through 3D vector field. Representation is made on top of a planisphere map of the zone.
To navigate, a flying metaphor is implemented using the joystick and orientation of the wand to compute a direction. User may also select the specific timestep of the simulation through pressing virtual buttons with his wand.